Key Metrics and Columns
The report includes detailed columns for tracking various aspects of project health:Effort Tracking
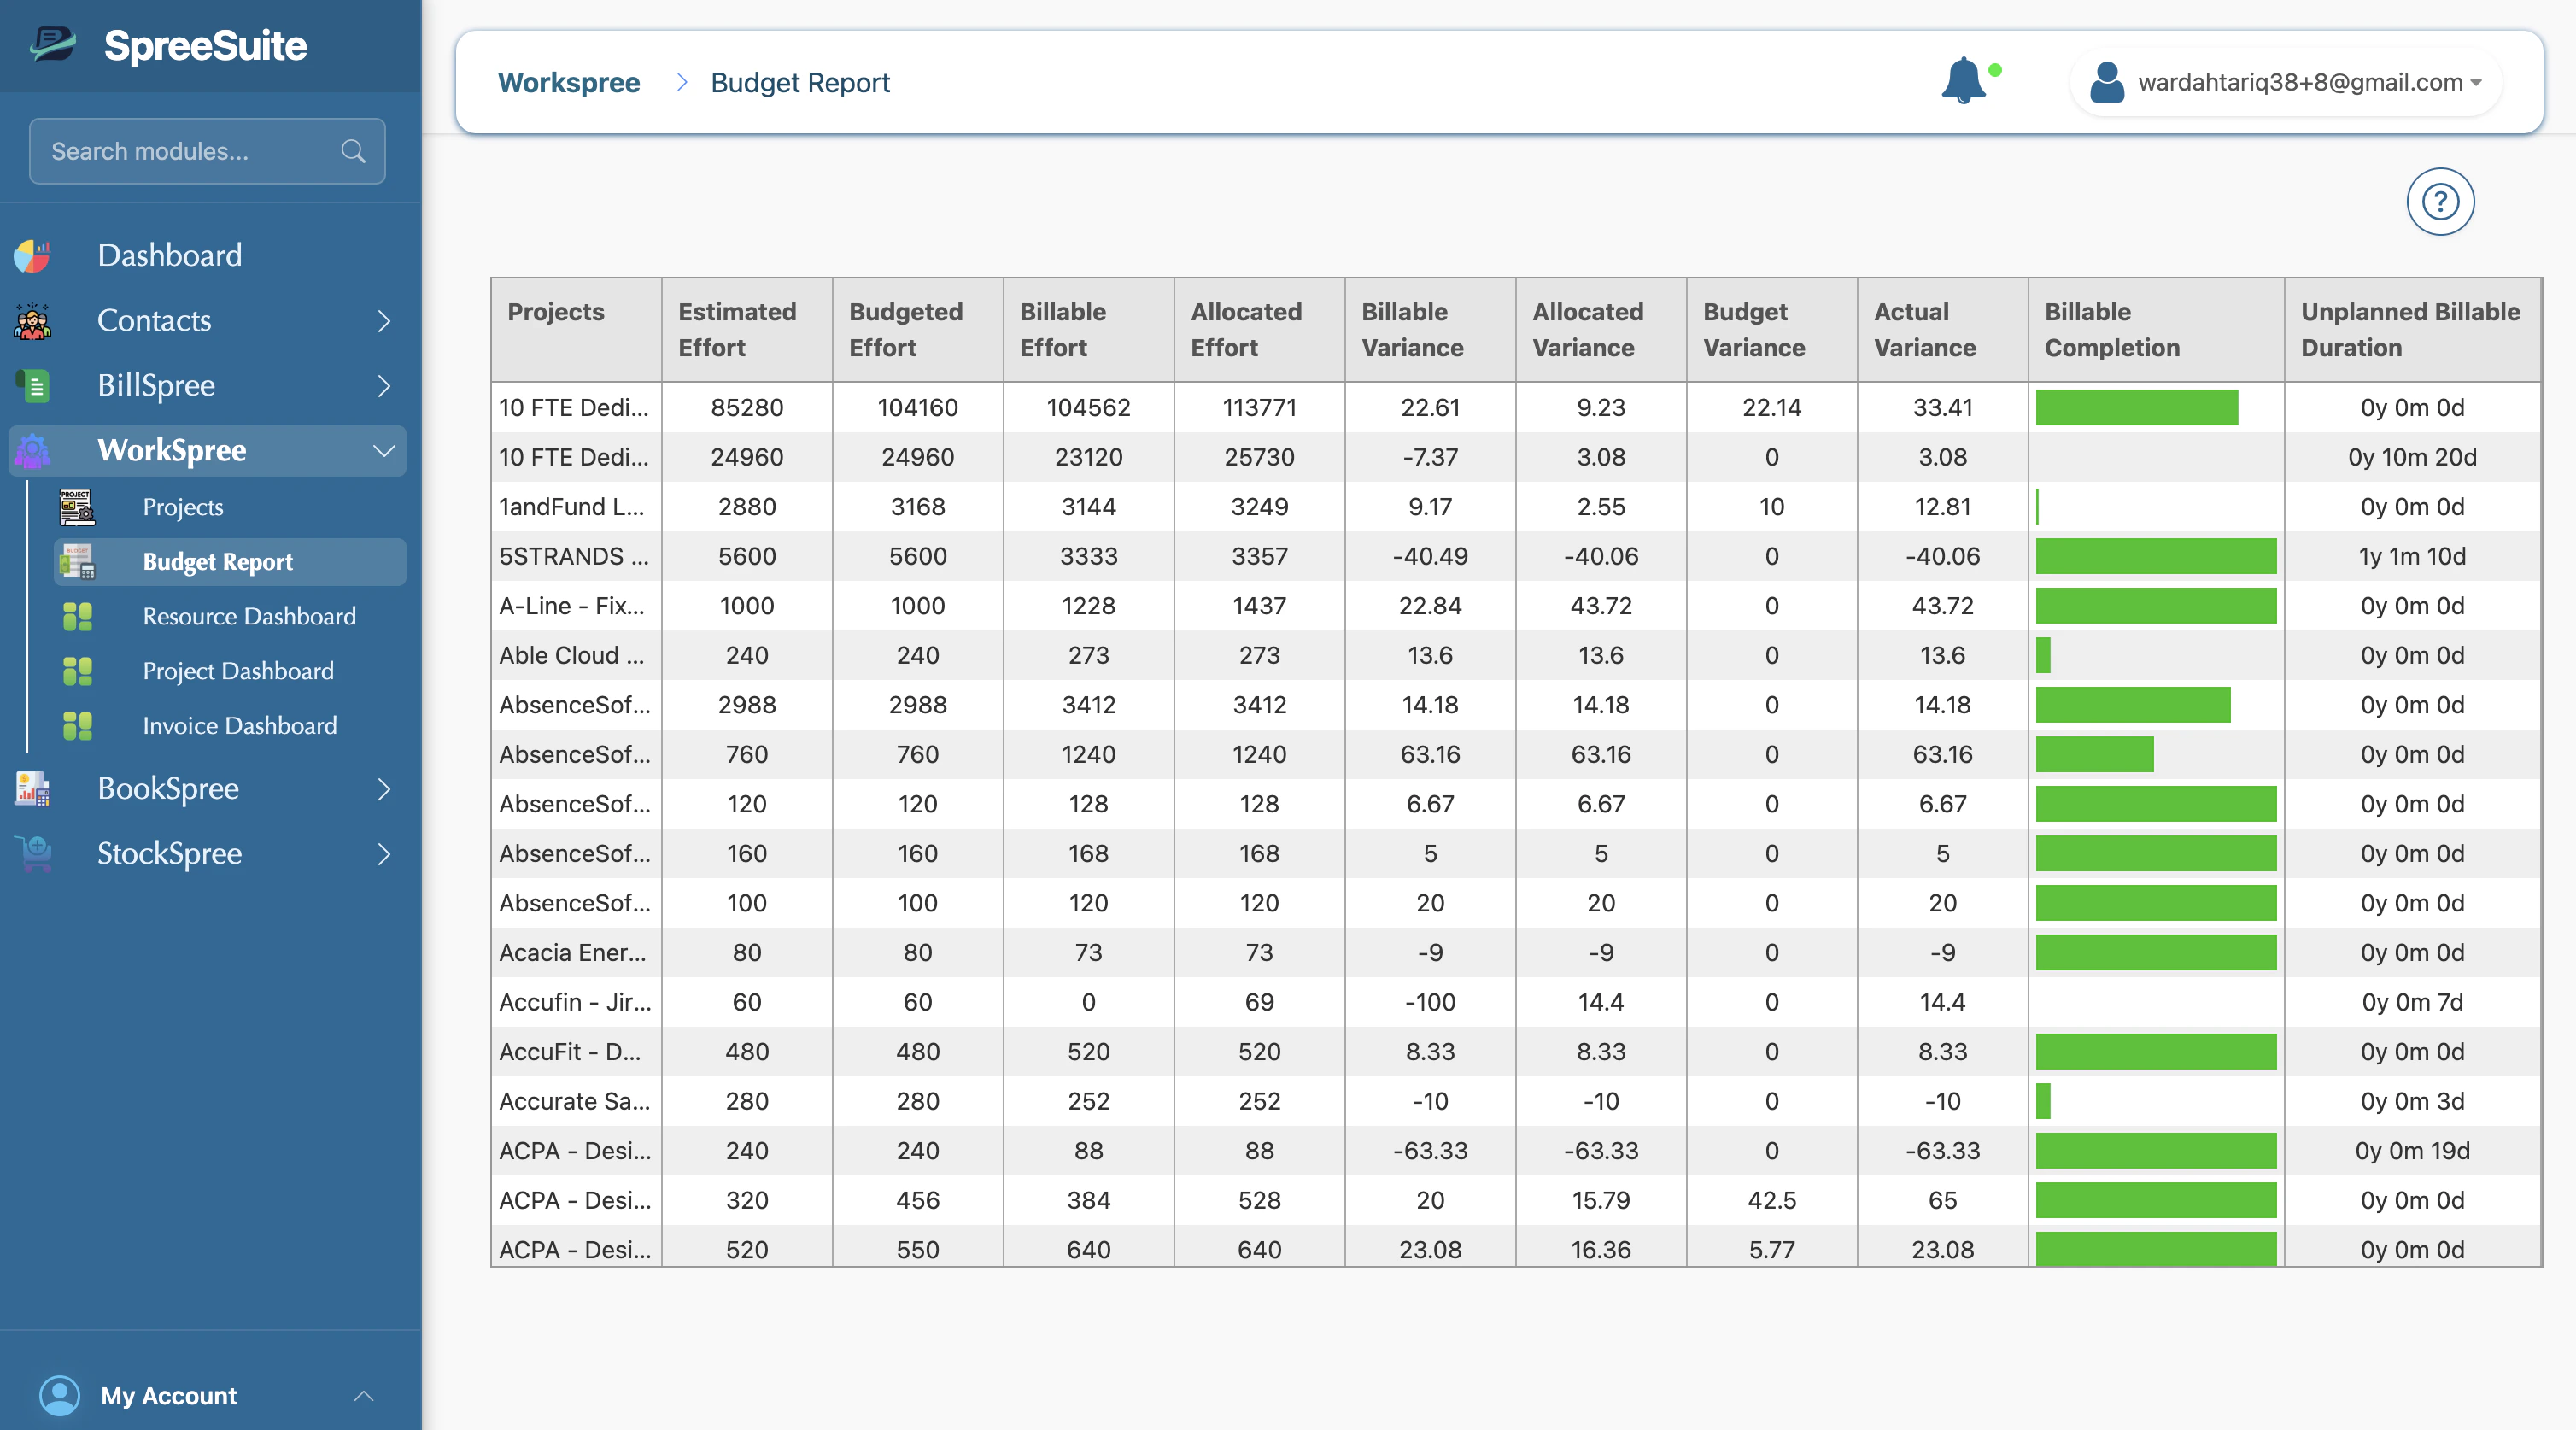
- Estimated Effort: The original effort estimate for the project.
- Budgeted Effort: The effort allocated within the approved budget.
- Allocated Effort: The effort currently assigned to specific people/resources.
- Billable Effort: The portion of the effort that can be charged to the client.
Variance Analysis
- Budget Variance: Total difference between used and budgeted effort.
- Billable Variance: Difference between billable effort and your comparison metric.
- Allocated Variance: Measures how closely actual allocations match the plan.
- Actual Variance: The gap between actual effort tracked and the original plan.
Completion & Extras
- Billable Completion: A visual progress bar showing the percentage of billable work completed.
- Unplanned Billable Duration: A count (e.g., “0y 2m 5d”) of extra billable time that was not part of the original scope.