> ## Documentation Index
> Fetch the complete documentation index at: https://docs.techfootintl.com/llms.txt
> Use this file to discover all available pages before exploring further.
# Resource Dashboard
> Understand team capacity and individual allocations across your projects.
The **Resource Dashboard** answers the critical question: *"Who is doing what, and when?"* It provides a high-level visualization of your workforce's allocation over time.
***
 ## **Dashboard Layout**
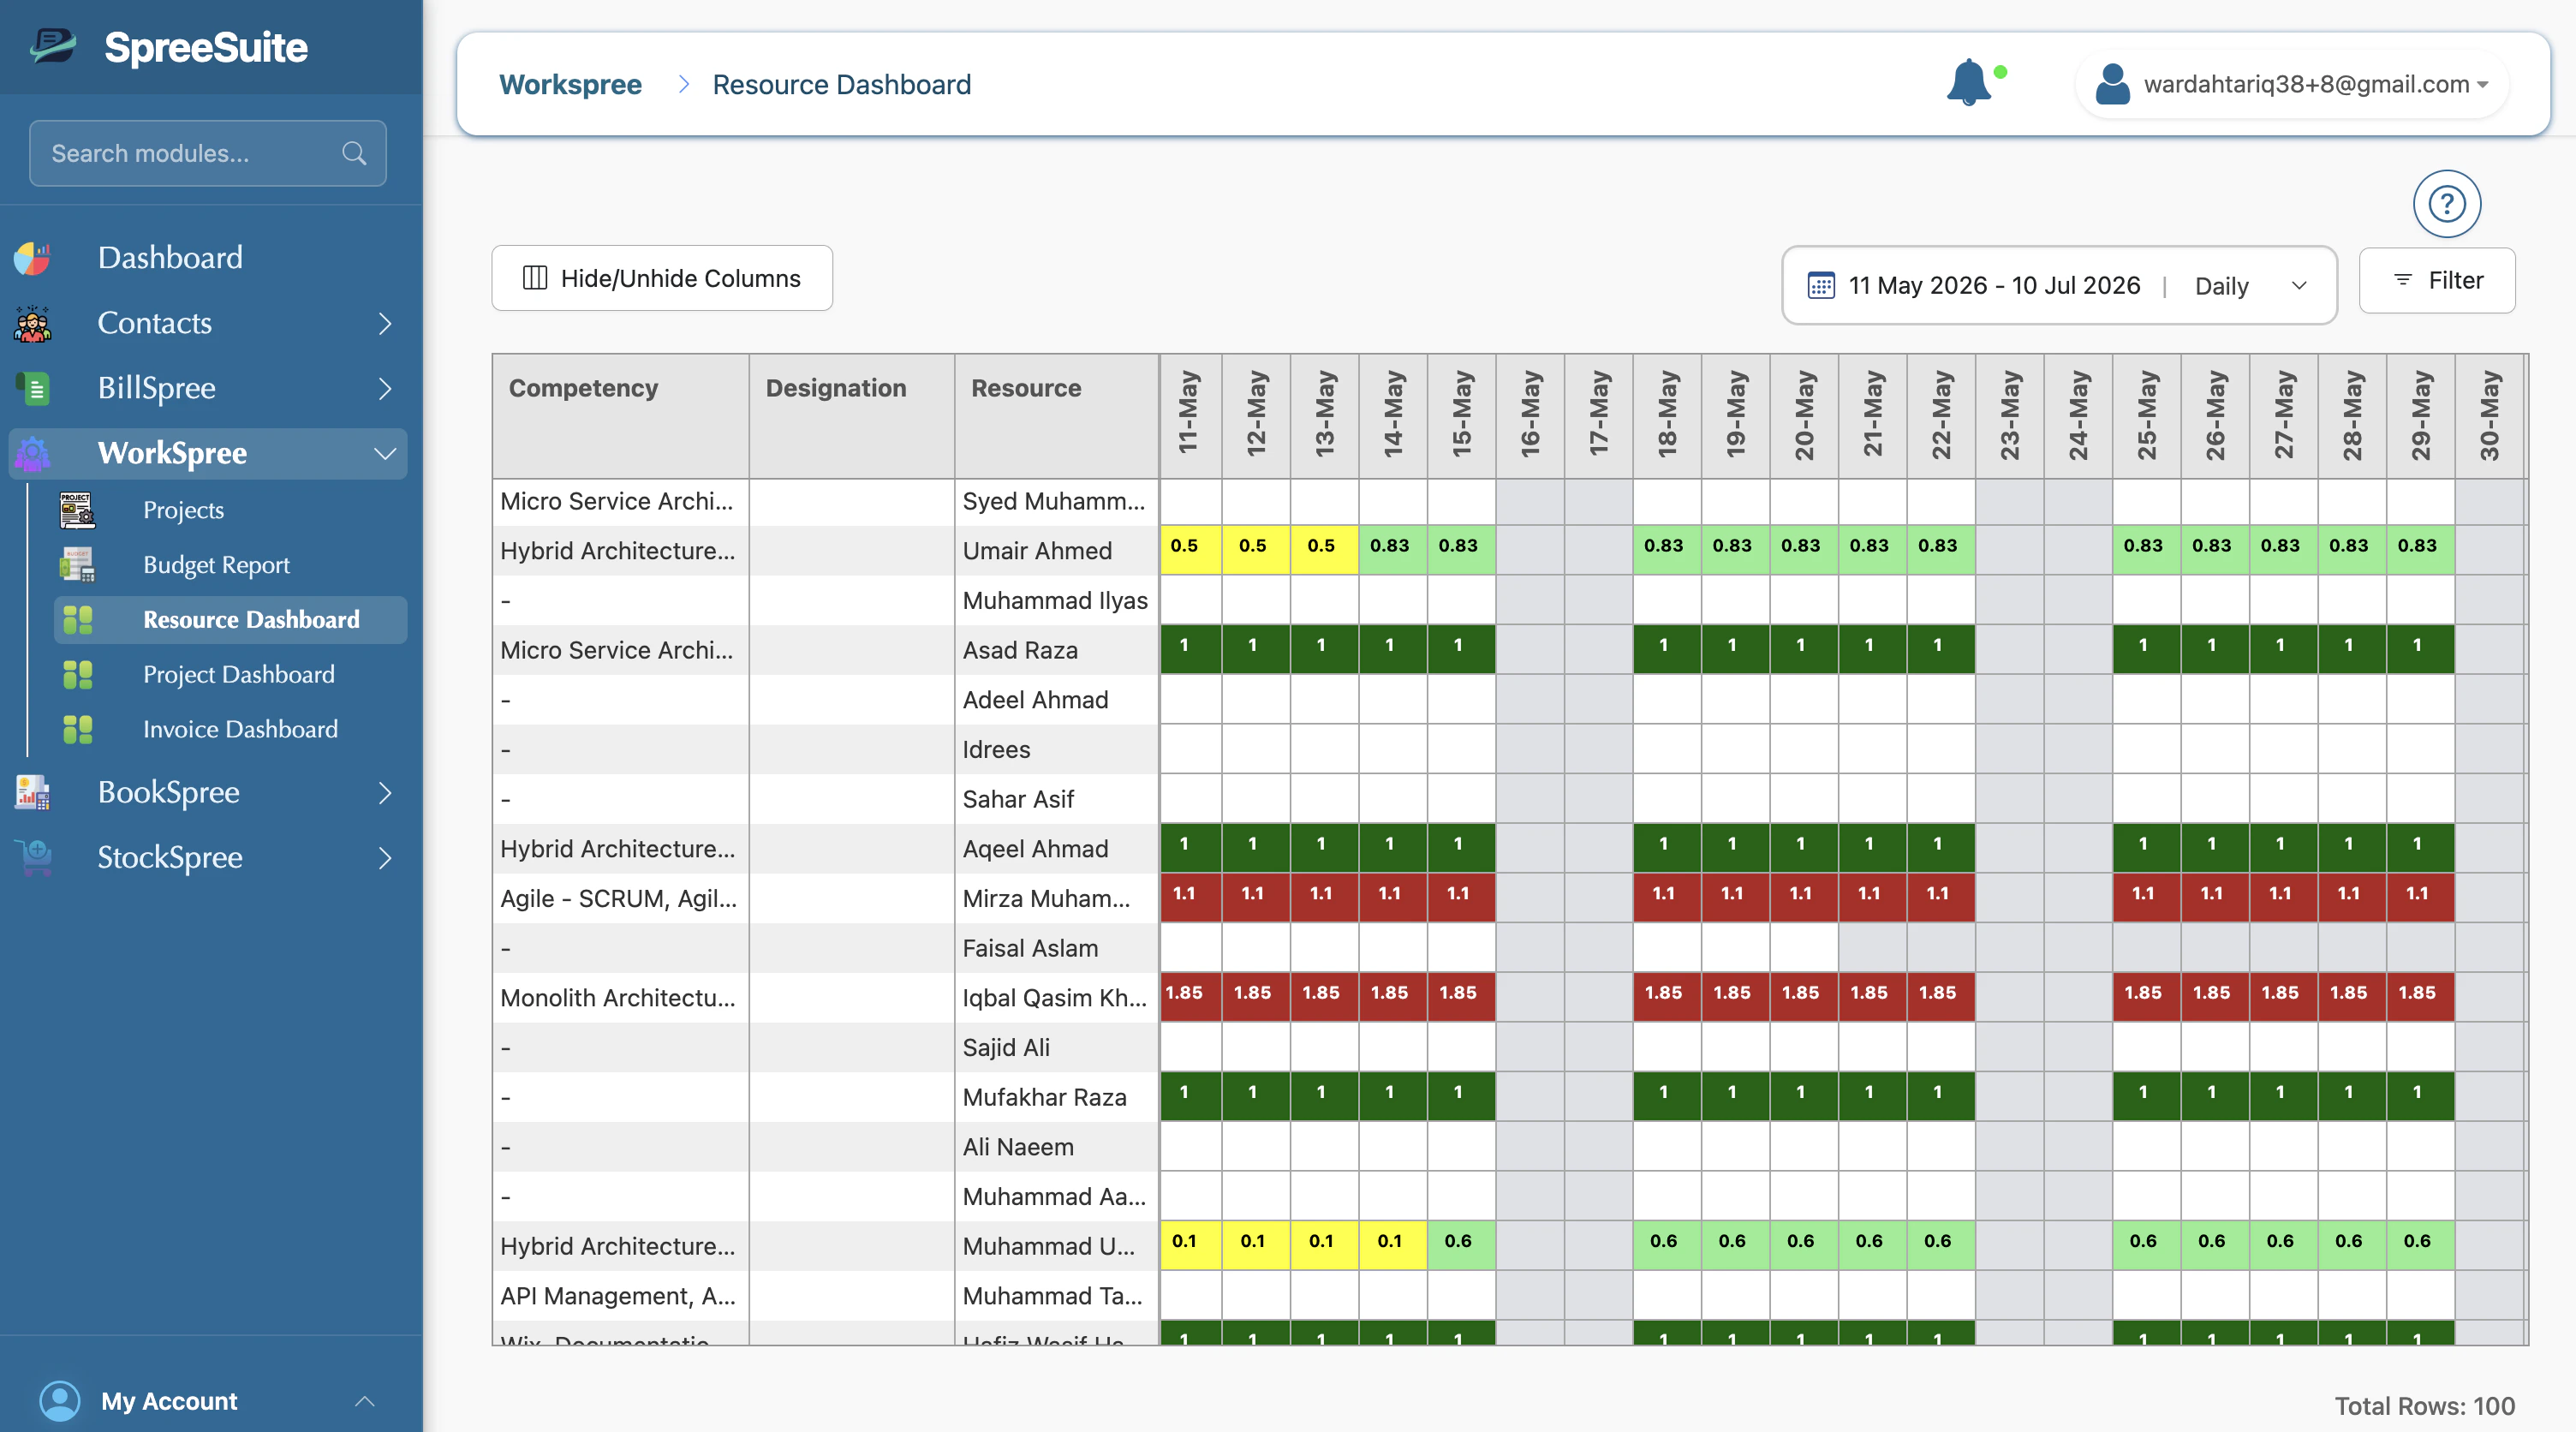
* **Rows**: Represent individual people (resources). Each row displays the resource's name, skillset, and total experience.
* **Columns**: Represent time periods. You can toggle the view between **Daily**, **Weekly**, or **Monthly** increments.
* **Cells**: Indicate the amount of effort or allocation for a person in that specific period.
### **Visual Indicators**
The dashboard uses color-coding to help you quickly identify allocation status:
* **Green**: Indicates active allocation during the period.
* **White**: Indicates no allocation (availability).
* **Weekends**: Highlighted differently to distinguish between working and non-working days.
***
## **Key Interactions**
### **1. Time Navigation**
Select a specific date range (e.g., this month, next quarter) to visualize capacity planning for that timeframe.
### **2. Dynamic Filtering**
Find the right people for your projects using powerful filters:
* **Status**: Filter by Active or Inactive resources.
* **Particulars**: Narrow down by Experience, Designation, Date of Joining (DOJ), or Contact details.
* **Competencies**: Filter by Category, Level, or Type of skill.
* **Security Attributes**: Match resources to projects based on required security clearances.
### **3. Column Management**
Customize your view by hiding or showing specific date columns, allowing you to focus on the timeframes that matter most to your planning.
## **Dashboard Layout**
* **Rows**: Represent individual people (resources). Each row displays the resource's name, skillset, and total experience.
* **Columns**: Represent time periods. You can toggle the view between **Daily**, **Weekly**, or **Monthly** increments.
* **Cells**: Indicate the amount of effort or allocation for a person in that specific period.
### **Visual Indicators**
The dashboard uses color-coding to help you quickly identify allocation status:
* **Green**: Indicates active allocation during the period.
* **White**: Indicates no allocation (availability).
* **Weekends**: Highlighted differently to distinguish between working and non-working days.
***
## **Key Interactions**
### **1. Time Navigation**
Select a specific date range (e.g., this month, next quarter) to visualize capacity planning for that timeframe.
### **2. Dynamic Filtering**
Find the right people for your projects using powerful filters:
* **Status**: Filter by Active or Inactive resources.
* **Particulars**: Narrow down by Experience, Designation, Date of Joining (DOJ), or Contact details.
* **Competencies**: Filter by Category, Level, or Type of skill.
* **Security Attributes**: Match resources to projects based on required security clearances.
### **3. Column Management**
Customize your view by hiding or showing specific date columns, allowing you to focus on the timeframes that matter most to your planning.