> ## Documentation Index
> Fetch the complete documentation index at: https://docs.techfootintl.com/llms.txt
> Use this file to discover all available pages before exploring further.
# Project Dashboard
> Visualize project timelines and workload distribution across your entire portfolio.
The **Project Dashboard** provides a project-centric view of effort, answering the question: *"Which project has work when?"* This dashboard is essential for managing deadlines and understanding peak workload periods across your organization.
***
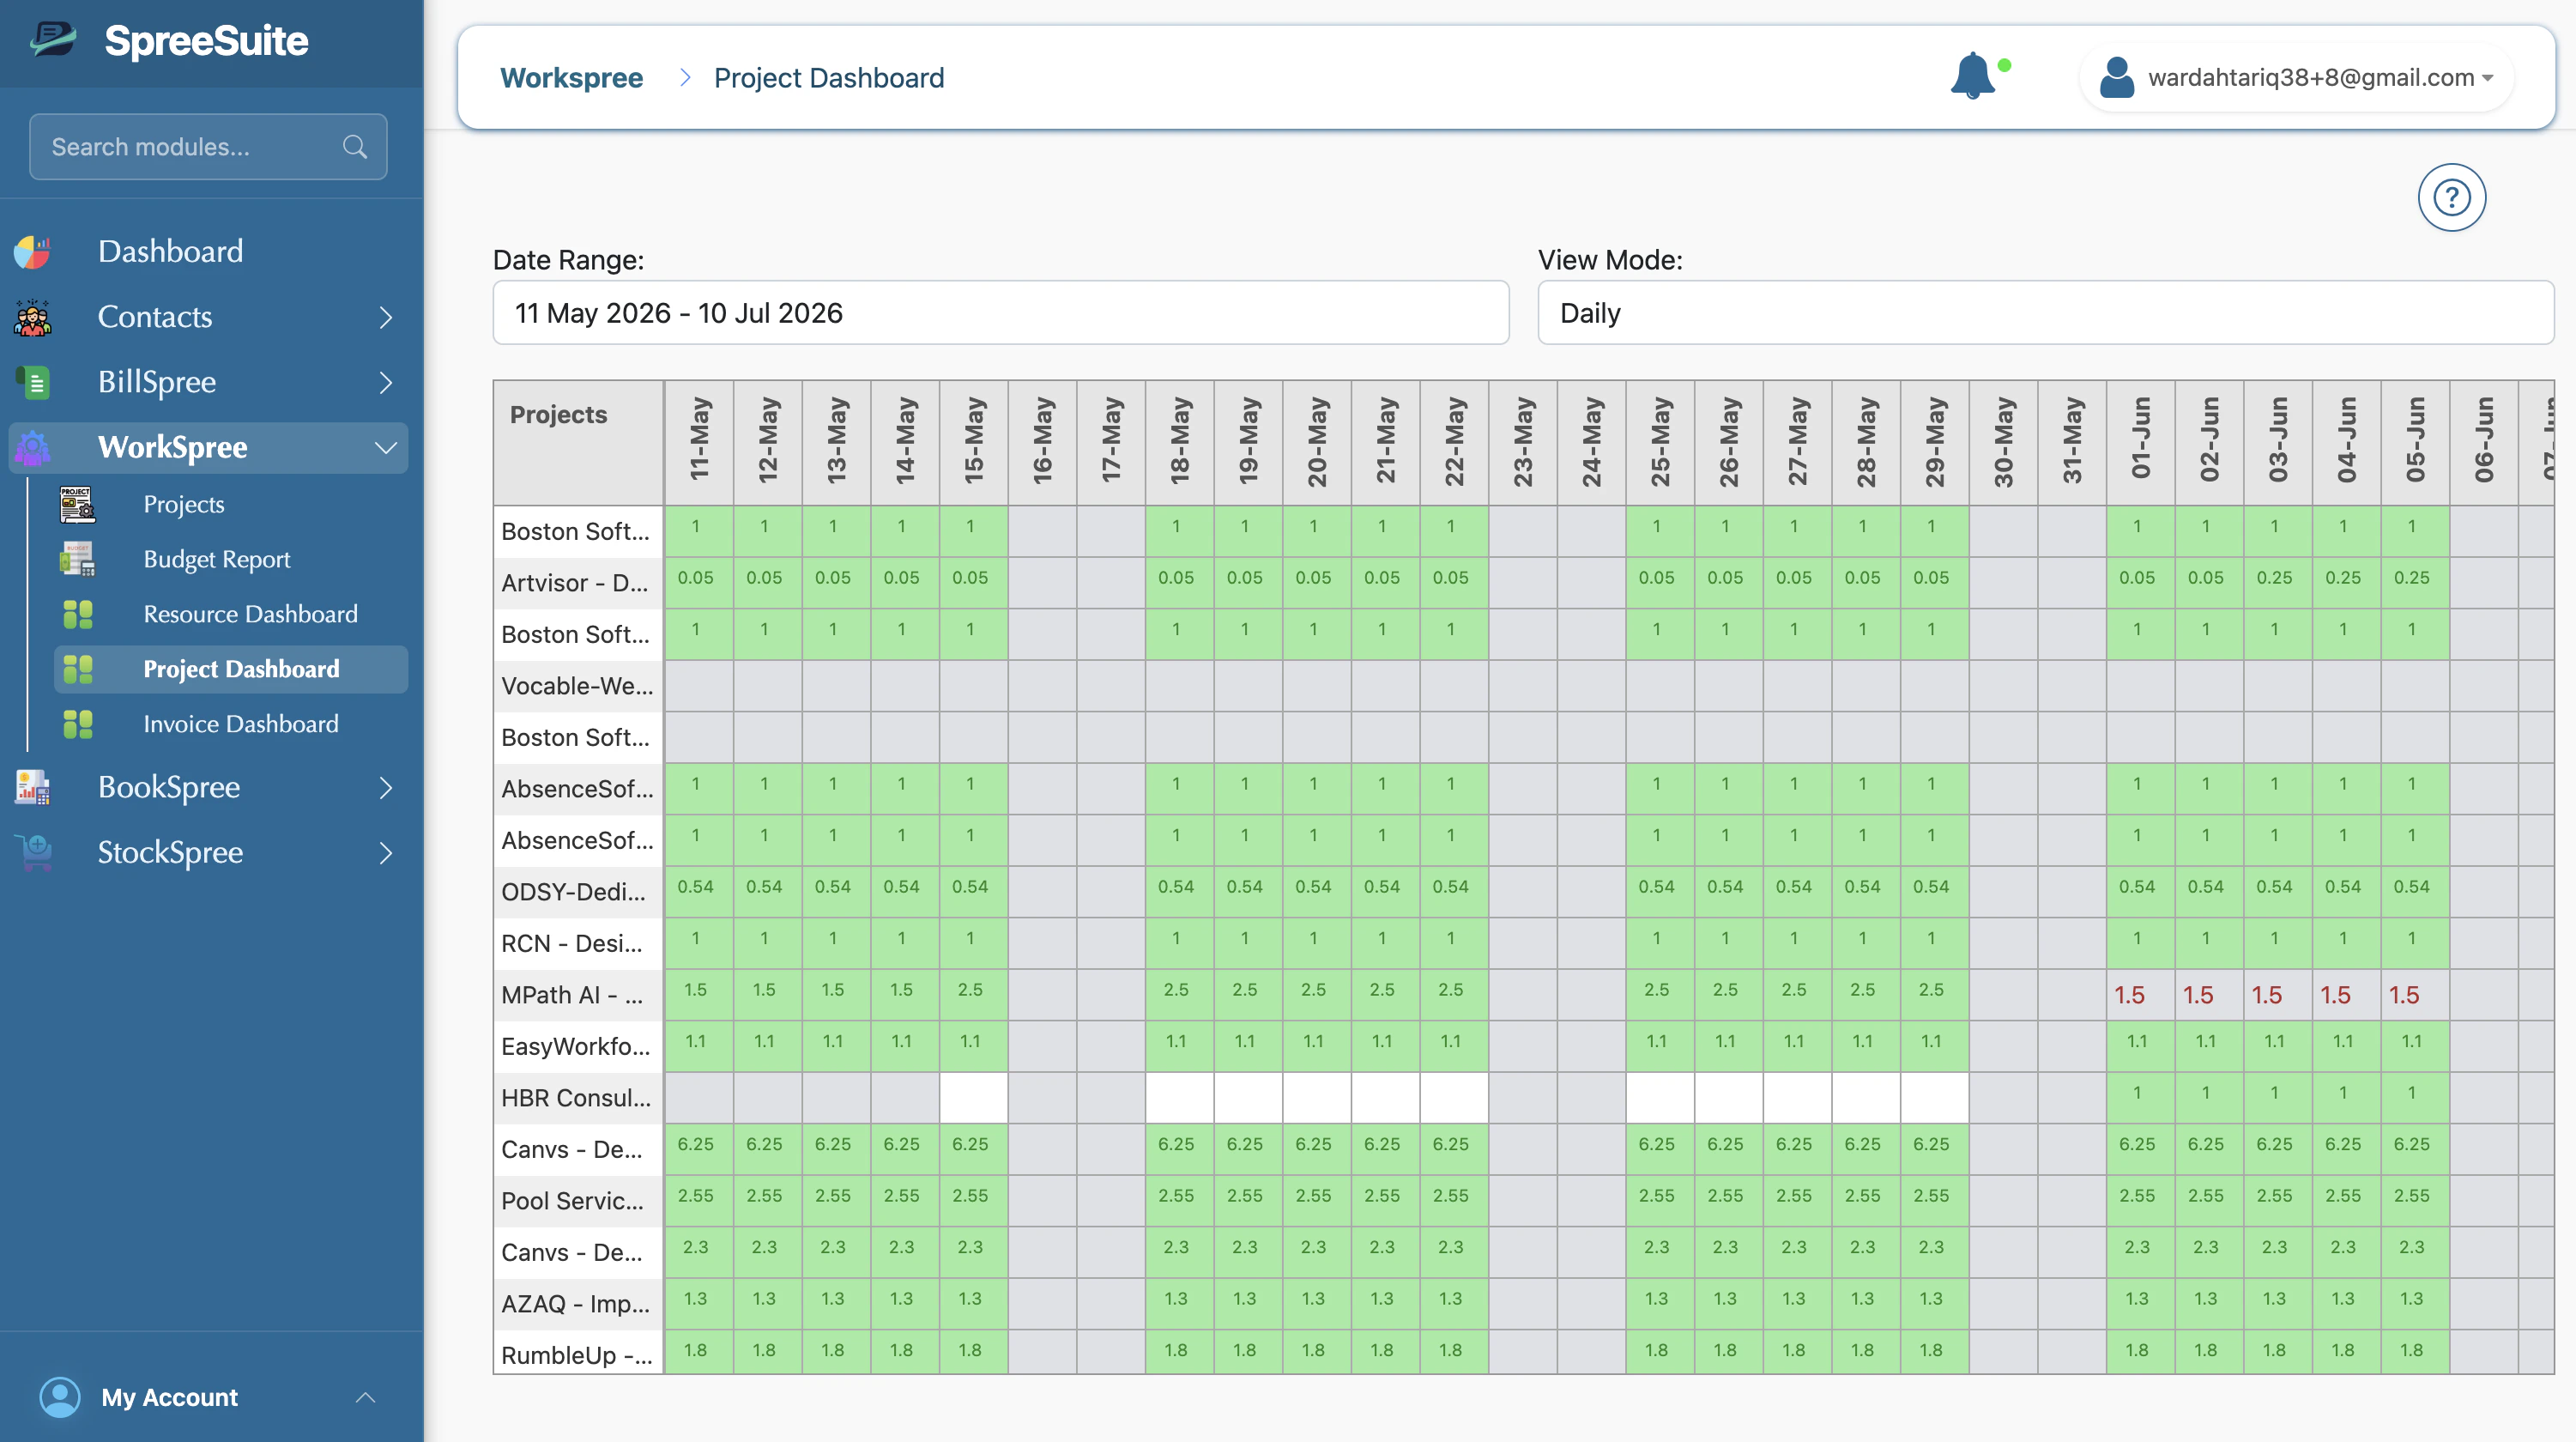 ## **Dashboard Layout**
* **Rows**: Represent individual projects.
* **Columns**: Represent the time axis, which can be viewed in **Daily**, **Weekly**, or **Monthly** modes.
* **Cells**: Represent the total allocated effort (e.g., total hours or person-count) for that project during the selected period.
### **Visual Highlights**
Similar to the Resource Dashboard, color-coding is used for quick scanning:
* **Green Cells**: Represent periods with active work or resource allocation.
* **White Cells**: Represent periods with no scheduled work.
* **Weekend Marking**: Clear visual distinction for non-working days.
***
## **Usage Scenarios**
* **Deadline Planning**: Identify when projects are entering high-intensity phases to ensure deadlines are realistic.
* **Resource Leveling**: See which projects are "heavy" in a specific month and adjust allocations to prevent team burnout.
* **Portfolio Overview**: Get a bird's-eye view of all ongoing work without diving into individual task details.
## **Dashboard Layout**
* **Rows**: Represent individual projects.
* **Columns**: Represent the time axis, which can be viewed in **Daily**, **Weekly**, or **Monthly** modes.
* **Cells**: Represent the total allocated effort (e.g., total hours or person-count) for that project during the selected period.
### **Visual Highlights**
Similar to the Resource Dashboard, color-coding is used for quick scanning:
* **Green Cells**: Represent periods with active work or resource allocation.
* **White Cells**: Represent periods with no scheduled work.
* **Weekend Marking**: Clear visual distinction for non-working days.
***
## **Usage Scenarios**
* **Deadline Planning**: Identify when projects are entering high-intensity phases to ensure deadlines are realistic.
* **Resource Leveling**: See which projects are "heavy" in a specific month and adjust allocations to prevent team burnout.
* **Portfolio Overview**: Get a bird's-eye view of all ongoing work without diving into individual task details.